Batch Farrowing Place
What is the point of the farrowing rate%
The farrowing rate is an assessment of the minimum number of females required to be mated to ensure that all the farrowing places in a batch are filled with a sow which farrows.
The farrowing rate % is not an assessment of how good you are breeding sows
This is not relevant to profit. Being great at breeding - but having empty farrowing places - losses your farm around 800kg of pig meat for each empty farrowing place (See cost of production).
There are many "farrowing rates"
Classically the farrowing rate is calculated as the
(The number of sows which farrow over a period/Number of sows and gilts bred over the same period)*100%
This is an average number - it has no specific bearing on the batch requirements. It can be useful as a guide, but this number has significant failings. Being an average, it means that 50% of the time you will have a farrowing rate higher than this number (for any single batch) and more significantly, 50% of the time you will have a farrowing rate lower than this number and this has the potential of leaving an empty farrowing place.
But I can play catch up on batches where the results are poor
No. This is a primary problem within the pig industry. If the farm is going to adopt all-in/all-out and batching, there is no concept of "catch up". If you have more sows farrowing than the farm has farrowing places this results in more piglets being available to wean - but only within this batch. If you start moving sows, early weaned piglets to make room for extra farrowing sows etc, all that happens is all-in/all-out is destroyed, piglets enter the nursery too young, sows and gilts are weaned too early. All these events have negative consequences on production and may cause the farm to break stocking regulations or weaning age legislation and increases diseases and poor health.
Examination of the
efficiency of batch breeding to fill the batch farrowing place
Obtain, a group of breeding reports. Note that
the start of each batch is the day after weaning (Batch
definition)
Place your actual numbers bred and farrowed, for each batch, into the yellow table below:
The default data above can also be examined graphically
These graphs will not change with your own data you will need to use your own excel - you can download the spreadsheet here.
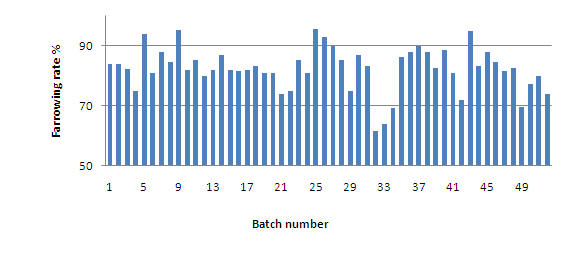
The farrowing rate by batch
Which indicates on this farm there is no specific seasonal influence on the farrowing rate. Although there were three batches around batch 30 which was below expectation.
Examination of the data by farrowing rate to demonstrate the expected normal spread of results
The number of batches which each farrowing rate

Comment
The analysis indicates that on 'average' the production figures were ok. The farm needs to farrow 20 a batch - which it did. The 82% farrowing rate is acceptable.
However, on 19 batches, out of the 52 examples, the farm actually failed to fill all of the farrowing places.
Over the 52 batches, there were actually 56 farrowing places which were empty. This was 560 piglets not weaned (10 weaned per farrowing place), these piglets were not weaned, finished, sold or slaughtered. All of the "fixed" costs associated with these animals had to be borne by other animals in this batch. These "fixed" costs, in this example, equated to £31K.
In order to fill all the available farrowing places (in 52 batches) the breeding target would have to be calculated from a different percentile farrowing rate. Traditionally the mean or average farrowing rate is used - this is the 50 percentile.
For example:
If we decided we had to fill all the farrowing places all the time, then the breeding target would be based on the lowest farrowing rate recorded - which in the above example is 62%. The breeding target would then be 33 a batch - a 500 sow unit compared to the 450 sow unit targeted.
These "extra" "insurance" sows cost money - largely in terms of feed. But models can be created to accommodate other costs. In the model above 10% extra is added. There are no lost production costs to be added - these animals are only to fill the available space.
In the example above, the extra sows to breed 33 a batch would cost an additional £12K. But this is still much less than the £35K loss of cost and profit associated with these empty farrowing places.
The health team needs to analyse previous performance to determine an acceptable breeding target. Obviously finding room for these "extra" sows also need to be considered.
Summary
The above example is only a model - although based on real farm data. The example farm also overproduced pigs in other batches, which is not taken into account in the above losses. On average the farm still produced it expected output. It could have achieved this output with less variation and thus stress on the system.
But the model does demonstrate that failure to fill each batch farrowing place results in enormous loss. On the other hand, a few extra breeding sows to ensure the majority batches are filled, costs less than the potential losses. Extra sows would not be required if the farm bred 25 a batch, had a farrowing rate of 80% of more and farrowed 20 a batch. This production could have been accomplished with the target 450 sow unit.
However:
Traditional production values need to be set aside and used as guides to production only, for example
Non productive Days
Pigs per Sow per Year
The excel spreadsheet used in this analysis